
Molecular Dynamics Simulation with AMBER: A Practical Guide – Part 1
- Ahmet Güveli

- Mar 6
- 5 min read
AMBER is the name of a software package used to perform biomolecular simulations. The development of the AMBER program began in the late 1970s. It was initially developed under the leadership of Peter Kollman, and its development is currently maintained by an active scientific community. The term “AMBER” has two distinct meanings. First, it refers to a family of molecular mechanics force fields used for simulating biomolecules and calculating potential energy. These force fields are publicly available and can be used in various molecular simulation programs. Second, the term AMBER also refers to the molecular dynamics simulation software package that contains the program codes themselves. The AMBER software is distributed in two main components: AmberTools and AMBER. AmberTools25 is a package that includes programs such as tleap and other utilities required for preparing and editing molecular structures prior to simulations. Amber24, on the other hand, is the core software responsible for performing the actual biomolecular simulations.
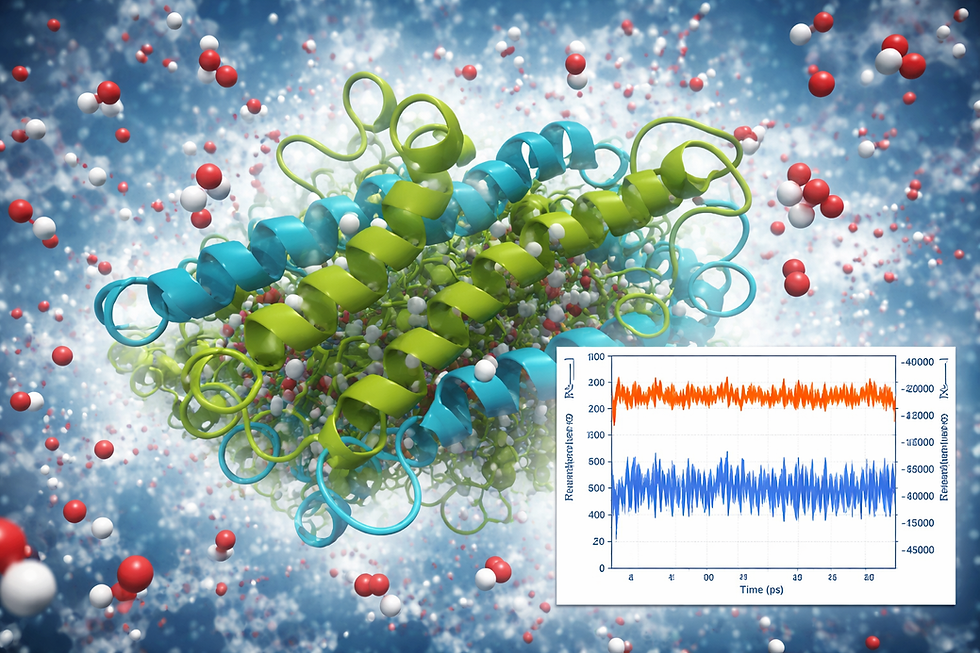
Protein Structure Examined in This Guide: Peptide Methionine Sulfoxide Reductase from E. coli (PDB ID: 1FF3)
The enzyme studied in this guide is peptide methionine sulfoxide reductase, which protects organisms against oxidative stress by reducing oxidized methionine residues present in protein structures. The crystal structure of the enzyme has a resolution of 1.9 Å and contains alpha-helical and beta-sheet secondary structure elements, while also comprising a substantial number of coil regions.
Among the three cysteine residues involved in the catalytic mechanism, Cys-51 is located in a soluble and conserved region at the beginning of an alpha helix. The other two cysteine residues (Cys-198 and Cys-206) are located in the C-terminal coil region, and mobility in this region is required for catalytic activity.
Within the scope of this guide, a classical molecular dynamics (MD) simulation protocol of 30 nanoseconds (ns) for peptide methionine sulfoxide reductase will be presented.
Step 1: Pre-Simulation Preparation
Before starting the simulation in AMBER, the file of the peptide methionine sulfoxide reductase protein with PDB ID: 1FF3 is first searched for and downloaded from the Protein Data Bank. The downloaded PDB file is then opened using the molecular visualization program BIOVIA Discovery Studio. Within the program, only chain A of the protein is retained. All other chains, their associated water molecules, and ions such as SO₄ are removed. The edited PDB file is then saved. Next, the modified PDB file is opened in the molecular visualization program PyMOL. By entering specific commands into the PyMOL terminal (console), the CAS atoms of the modified cysteine residues are converted to standard CYS residues, and the atoms that do not belong to cysteine (AS, CE1, and CE2) are removed.
Commands to be entered in PyMOL:
> alter resn CAS, resn = "CYS"
Then, to remove the atoms that are not part of CYS:
# Only the standard atoms of CYS.
> standard_atoms = ["N", "CA", "C", "O", "CB", "SG"]
> cmd.select("bad_atoms", "resn CYS and not name " + "+".join(standard_atoms))
> cmd.remove("bad_atoms")
After completing the modifications in PyMOL, the edited PDB file is then saved.
Step 2: pKa Determination and Protonation Assignment
pKa is defined as the negative base-10 logarithm of an acid’s dissociation constant, Ka. Therefore, pKa provides a measure of how easily a molecule donates its proton [H⁺] in solution, reflecting the molecule’s acidity. Strong acids have low pKa values, while weak acids have high pKa values (6). The pKa value determines whether a molecule will be charged or neutral under a specific pH condition.
Protonation refers to the process by which H⁺ ions in the environment bind to a molecule. Proteins are composed of amino acids, which are organic molecules containing both amino (-NH₂) and carboxyl (-COOH) functional groups. Amino acids can exist in different protonation states. These states play a critical role in the conformational stability of proteins and nucleic acids as well as their catalytic activity. The protonation state of an amino acid residue or ligand in a protein can deviate from the local pH depending on the dielectric properties of its surrounding environment and the hydrogen bonds formed with neighboring residues (7).
For pKa determination, the PROPKA tool is used (8). The PDB file edited in PyMOL is uploaded to the PROPKA website to perform the pKa calculation. This calculation can be done through the website, or if Python is installed on your computer and added to the PATH, the same calculation can be performed using the propka3 program. To install the propka3 program, open a terminal and:
“pip install --upgrade propka”
The command is entered, allowing the propka3 program to be installed via pip, and then in the terminal:
> propka3 proteinname.pdb
The command is executed to run the propka3 program. The program generates a “.pka” file, which contains the predicted pKa values for the residues of the protein.
For example, some of these values for the peptide methionine sulfoxide reductase protein we are working on are:
Amino Acid | No. | Chain | Predicted pKa | Model pKa |
ASP | 4 | A | 4.34 | 3.80 |
ASP | 89 | A | 3.21 | 3.80 |
ASP | 101 | A | 2.70 | 3.80 |
ASP | 165 | A | 1.87 | 3.80 |
GLU | 43 | A | 4.97 | 4.50 |
GLU | 94 | A | 8.20 | 4.50 |
GLU | 154 | A | 4.67 | 4.50 |
GLU | 210 | A | 4.77 | 4.50 |
C-Terminus | 211 | A | 3.31 | 3.20 |
HIS | 7 | A | 6.27 | 6.50 |
HIS | 130 | A | 5.87 | 6.50 |
HIS | 168 | A | 6.28 | 6.50 |
HIS | 191 | A | 5.97 | 6.50 |
CYS | 86 | A | 11.54 | 9.00 |
CYS | 198 | A | 9.13 | 9.00 |
CYS | 206 | A | 9.59 | 9.00 |
TYR | 66 | A | 9.75 | 10.00 |
TYR | 72 | A | 16.66 | 10.00 |
TYR | 76 | A | 10.39 | 10.00 |
TYR | 82 | A | 13.67 | 10.00 |
LYS | 5 | A | 11.32 | 10.50 |
LYS | 6 | A | 10.41 | 10.50 |
LYS | 192 | A | 10.12 | 10.50 |
ARG | 18 | A | 14.00 | 12.50 |
ARG | 57 | A | 12.03 | 12.50 |
ARG | 150 | A | 13.03 | 12.50 |
ARG | 155 | A | 12.71 | 12.50 |
N-Terminus | 1 | A | 7.70 | 8.00 |
Ligand (CYS SG) | - | A | 15.22 | 10.00 |
A table like this is obtained. Based on the pKa values provided in the table and the condition of pH = 7, the possible protonation states of the relevant residues are evaluated.
After the protonation analysis, the PDB file of the protein is moved to the working directory via the terminal:
> pdb4amber -i protein.pdb -o edited.pdb
By running the command, the PDB file is converted into a format that AMBER can process. Then, by opening the PDB file, the protonation states of specific amino acid residues are adjusted according to the pKa analysis we performed.
Step 3: Creating the Tleap.in File
In the working directory, open the terminal and enter:
> nano tleap.in
to create the tleap.in file.
Inside this file, enter the following commands:
source leaprc.protein.ff14SB !Protein force field
source leaprc.water.tip3p !TİP3P water model
mol = loadpdb edited.pdb !Load the edited PDB file
solvatebox mol TIP3PBOX 10.0 !Solvate the system: TIP3P water model, 10 Å overflow allowance
addions mol K+ 0 !Neutralize the system
saveamberparm mol system.prmtop system.inpcrd !Save topology and coordinate files
savepdb mol system_leap_output.pdb
quit
After entering these values, save the tleap.in file. Then, in the terminal, run:
> tleap -f tleap.in
Once the command finishes, the following files are important: system_leap_output.pdb, output.pdb, system.prmtop, and system.inpcrd. system.prmtop is the topology file. system_leap_output.pdb is the PDB file with the water box added and ions included. system.inpcrd contains the coordinates of all atoms in the system.

References
1. https://ambermd.org/ date of access: 04.03.2026
2. Tête-Favier, F., Cobessi, D., Boschi-Muller, S., Azza, S., Branlant, G., & Aubry, A. (2000). Crystal structure of the Escherichia coli peptide methionine sulphoxide reductase at 1.9 A resolution. Structure (London, England : 1993), 8(11), 1167–1178. https://doi.org/10.1016/s0969-2126(00)00526-8
3. Burley, S. K., Berman, H. M., Kleywegt, G. J., Markley, J. L., Nakamura, H., & Velankar, S. (2017). Protein Data Bank (PDB): The Single Global Macromolecular Structure Archive. Methods in molecular biology (Clifton, N.J.), 1607, 627–641. https://doi.org/10.1007/978-1-4939-7000-1_26
4. BIOVIA, Dassault Systèmes, BIOVIA Discovery Studio Visualizer, 2020, San Diego: Dassault Systèmes.
5. DeLano, W. L. (2002). The PyMOL molecular graphics system. http://www.pymol.org/.
7. Nelson, D. L., & Cox, M. M. (2021). Lehninger Principles of Biochemistry. (8. Baskı). W. H. Freeman
8. Søndergaard, C. R., Olsson, M. H., Rostkowski, M., & Jensen, J. H. (2011). Improved Treatment of Ligands and Coupling Effects in Empirical Calculation and Rationalization of pKa Values. Journal of chemical theory and computation, 7(7), 2284–2295. https://doi.org/10.1021/ct200133y


Comments